At Zelis, we’re all about modernizing the healthcare financial experience. That means looking for opportunity everywhere. By that, I mean literally ev-er-y-where. Even in constellations of the billions of disparate and obfuscated data points as the Transparency in Coverage rule’s ‘Machine-Readable File (MRF)’ — which is not unlike trying to find Orion’s Belt on a cloudy night.
What the heck am I talking about? The huge opportunity that exists before us if we are only to look… okay, and to apply some powerful technology capabilities and a good deal of expertise in deciphering healthcare data.
Let’s quickly recap. The federal Transparency in Coverage (TiC) rule requires health insurance issuers to disclose pricing for covered services and items. Insurers must include provider-negotiated rates, as well as allowed billable amounts (aka the maximum accepted price for a given service) for all out-of-network providers. These are disclosed via MRFs.
The government claims that this rule will, “reduce the secrecy behind health care pricing with the goal of bringing greater competition to the private health care industry,” because it gives consumers, “the tools needed to access pricing information through their health plan.”
While a noble intention, the reality is that on their own, MRFs are difficult, if not impossible, to understand or use – and do not accomplish the administration’s intent. More than half of Americans struggle with health insurance literacy, with as many as 77% being confused by basic terms like coinsurance, copayment, and deductible.
MRFs are extremely large, lacking grossly important details (e.g., geography, specialty, provider network) which are also not normalized across the files, and are updated monthly. How could we possibly expect the average healthcare consumer to ingest, aggregate, and compare this information?
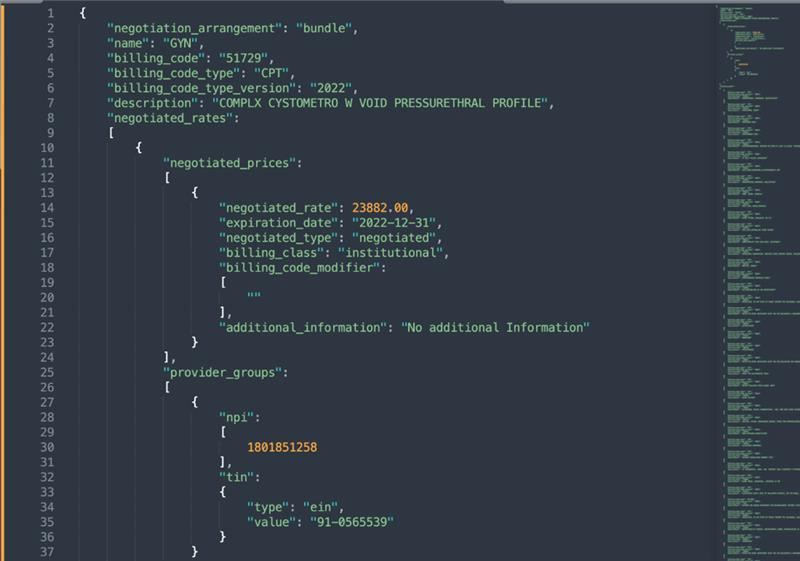
A MRF, on its own, isn’t user friendly. It appears like lines of computer codes. Finding a single rate for a physician at a facility, for example, requires querying billions of lines of data in real-time. See below:

But what if I told you that if we could unlock this data, we could meet the government’s full intention of controlling the rising cost of healthcare? That the now publicly available MRF data could provide unprecedented opportunities to help drive price comparison, network optimization, and innovation?
Meet Zelis Healthcare Insights 360SM
Ok, let’s nerd out for a moment, my healthcare friends. Close your eyes and imagine a world where you can:
- Better manage your financial performance and planning
- Understand how your cost position compares to the market
- Make strategic decisions for geographic and quality-based plan growth
- Leverage pricing data to showcase plan value to prospective clients
As one of the last remaining independent healthcare financial workflow companies, we’re in a unique position to deliver high ROI solutions that align interests to the benefit of all.
With our expertise and visibility across the healthcare financial system and ability to ingest, normalize, and interpret vast data sets, we’re developing capabilities to help the industry collectively drive down exponentially growing costs without compromising clinical quality. We call this Healthcare Insights 360SM.
One of our goals is to identify, optimize, and solve problems holistically with technology built by healthcare experts — driving real, measurable results for clients. Our latest solution is no different. Built with proven network analytics technology, vast data sets, and expertise hosting, creating, ingesting, and analyzing MRF files, this solution was built to evolve as MRF formats and needs evolve.
Zelis Healthcare Insights 360 SM synthesizes MRFs into cogent data for payers. In this table, two competing health plans’ costs for knee arthroscopy ACL repair (in the same market and at identical facilities with the same physicians and billing codes) are extracted from MRFs to help a payer evaluate and determine network costs and identify saving opportunities.

Simply put, our one-stop-shop solution ingests and analyzes publicly-available MRF data and turns it into an easy-to-use dashboard, through which payers can visualize differences in rates across plans and providers, down to the specific CPT code.
Meaning: you no longer need to worry about digesting the data or divining its meaning in the stars. Rather, you just need to consider how to use the insights we can unlock for you.
To see how you can get started using our latest solution, dive deeper and connect with us..
And until next time, stay well!
Get the latest articles, events, webinars, and more in our monthly digest.


